Bitcoin price traded to a new 2019 high close to $5,500 before starting a downside correction. BTC declined below the $5,200 support and it may even test $4,830 before a fresh increase in the coming sessions.
Likewise, altcoins such as Ethereum (ETH), ripple (XRP), bitcoin cash (BCH), litecoin (LTC), binance coin (BNB), stellar (XLM), ADA, EOS and TRX corrected lower below key supports. They might extend losses, but downsides are likely to be contained.

Trade at eToro, Read our Review
Key Takeaways:
- Bitcoin price surged to a new yearly high before correcting below the $5,200 support.
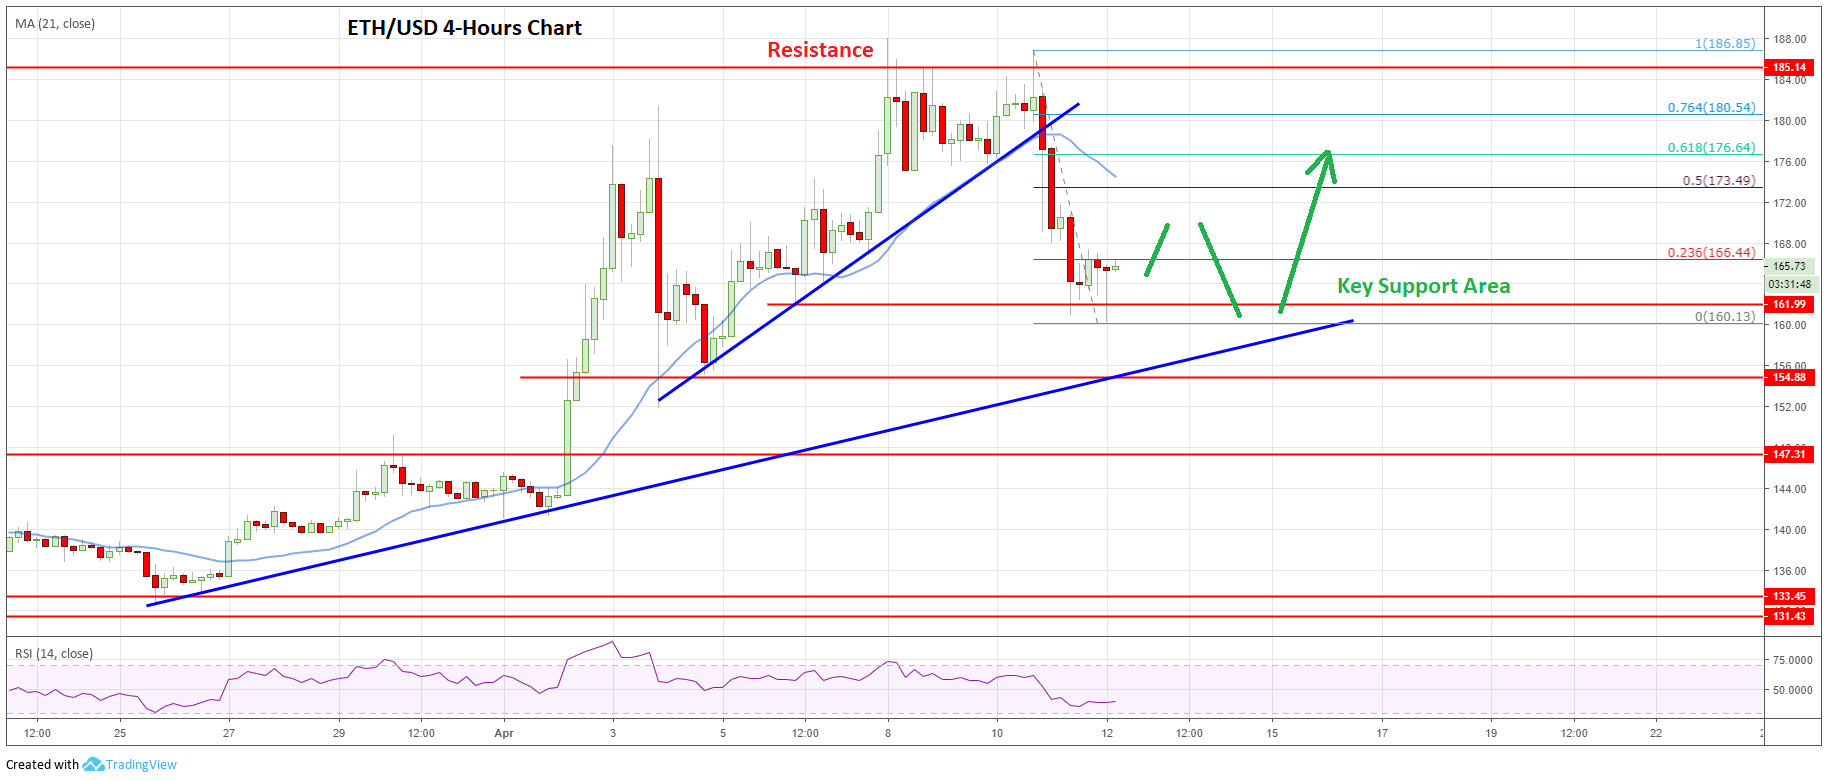
- Ethereum price failed to overcome the $185 hurdle and declined below $175.
- Ripple price broke a crucial support area near the $0.3410 level to move into a bearish zone.
- EOS price climbed above the $6.00 resistance before starting a downside correction.
- ECT surged around 1500% and LAMB is up around 500% in the past 7 days.
Bitcoin Price Analysis
There were strong gains in bitcoin price earlier this week above the $5,200 resistance level. BTC even broke the $5,400 resistance level and traded to a new yearly high close to $5,500 before starting a downside correction.

Bitcoin Price Chart: Click to Enlarge
Looking at the 4-hours chart, the price traded as high as $5,492 and recently started a sharp downside correction. It broke the $5,400 support level and the 21 simple moving average (4-hours) to move into a short term bearish zone.
There was a break below the 23.6% Fib retracement level of the recent wave from the $4,124 swing low to $5,492 high. More importantly, there was a break below a major ascending channel with support near the $5,170 level on the same chart.
It opened the doors for more losses below the $5,200 support level. The price settled below the $5,200 level and the 21 simple moving average (4-hours). It even spiked below the $5,000 level and it is currently correcting higher.
On the upside, the previous support near the $5,175 and $5,200 levels is likely to act as a strong resistance since the 21 simple moving average (4-hours) is also near $5,200.
On the downside, the main support is near the $4,830 level and the 50% Fib retracement level of the recent wave from the $4,124 swing low to $5,492 high. Therefore, if bitcoin price corrects lower further, it is likely to find a strong buying interest near the $4,820 and $4,830 levels.
Once the current correction is complete either near $5,000 or $4,830, the price is likely to bounce back above $5,100 and $5,200 in the coming days.
Ethereum Price Analysis
Ethereum price climbed above the $180 level and traded to a new 2019 high near the $187 level. However, ETH struggled to settle above the $185 resistance and later declined sharply below the $182 and $180 support levels.
Ethereum Price Chart: Click to Enlarge
Looking at the 4-hours chart, the price declined from the $187 swing high and broke the $180 and $175 support levels. There was a break below a key bullish trend line with support at $178 on the hourly chart.
Moreover, there was a close below the $175 support and the 21 simple moving average (4-hours). The price even broke the $170 support level and tested the next key support near the $160 level.
At the moment, the price is correcting higher and testing the 23.6% Fib retracement level of the last decline from the $187 swing high to $160 low. However, there are many resistances on the upside near the $172 and $173 levels.
The 50% Fib retracement level of the last decline from the $187 swing high to $160 low is also near the $173 along with the 21 simple moving average (4-hours) to act as a strong hurdle for buyers.
On the downside, the main support is at $158 and a connecting bullish trend line. In the short term, there could be a swing moves, but sooner or later the price is likely to bounce back above $175 as long as it is trading above the $155 level.
Ripple Price Analysis
There was a sharp upward move above the $0.3700 level in ripple price against the US Dollar. XRP/USD even spiked above the $0.3800 level and traded to a new monthly high at $0.3834 before starting a major downside correction.

Ripple Price Chart: Click to Enlarge
Looking at the 4-hours chart, the price clearly struggled to stay above the $0.3750 resistance level. It made many attempts to gain strength, but it failed and declined sharply below the $0.3600 support level.
There was a break below a crucial contracting triangle with support at $0.3410 on the same chart, opening the doors for more losses. Moreover, there was a break below the 61.8% Fib retracement level of the last wave from the $0.2984 low to $0.3834 high.
Finally, there was a close below the $0.3400 level and the 21 simple moving average (4-hours). The price tested the $0.3180 support and the 76.4% Fib retracement level of the last wave from the $0.2984 low to $0.3834 high.
At the outset, the price seems to be trading in a bearish zone below the $0.3400 support area. If there is an upside correction, the same support near $0.3400 is likely to act as a significant resistance in the near term.
EOS Price Analysis
There was a slow and steady rise in EOS price above the $4.20 and $4.80 resistance levels against the US Dollar. The price even broke the $5.00 and $5.50 resistance levels to trade to a new 2019 high.

EOS Price Chart: Click to Enlarge
Looking at the 4-hours chart, the price climbed above the $6.00 resistance and traded as high as $6.079. Later, there was a sharp downward move below the $6.00 and $5.75 support levels.
The decline was such that the price broke the key $5.60 support and the 21 simple moving average (4-hours). There was a break below a major bullish trend line with support near the $5.50 level on the same chart.
The price tested the next key support at $5.10 and another major bullish trend line. It managed to stay above the $5.00 and $5.10 support levels. A swing low was formed at $5.09 and the price is currently correcting higher.
It climbed above the 23.6% Fib retracement level of the recent decline from the $6.079 high to $5.094 low. However, the price could face a strong resistance near the $5.60 level and the 21 simple moving average (4-hours).
Besides, the 50% Fib retracement level of the recent decline from the $6.079 high to $5.094 low is also near the $5.60 level. In the short term, there could be swing moves, but EOS price is likely to climb above $5.60 once again as long as it is above the $5.00 support.
Top Gainers
During the past 7 days, many small cap altcoins rallied and gained more than 100%, including ECT, LAMB, LUC, 2GO, ZEL, MEX, S4F, BRC, EKT, DEX, EQUAD and METM (trading volume more than $50K). Out of these, ECT rallied around 1500% and LAMB gained nearly 520%.
Overall, bitcoin price started a major downside correction from the $5,500 resistance area. However, there is a strong support near the $4,800 area and sooner or later BTC is likely to bounce back.
Similarly, there could be another downward move in Ethereum, ripple, bitcoin cash, litecoin, XLM, ADA, TRX, EOS, ICX, BNB, XMR, WTC and ICX before a fresh increase.
The market data is provided by TradingView, Bitfinex.
The post Price Watch: Bitcoin, Ethereum, Ripple and EOS Price Analysis 12th April appeared first on Blockonomi.
April 12, 2019 at 04:04AM https://blockonomi.com from Blockonomi http://bit.ly/2GkSfQD